experimental results
experimental results of surface reorientation of free capillary interfaces upon step reduction in gravity
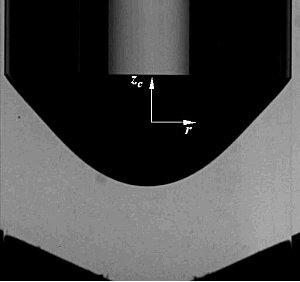
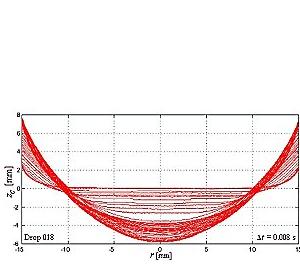
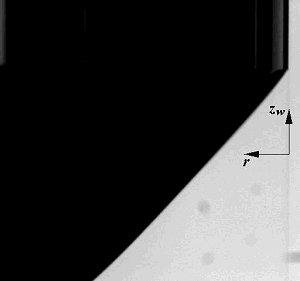
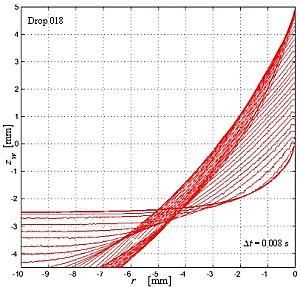
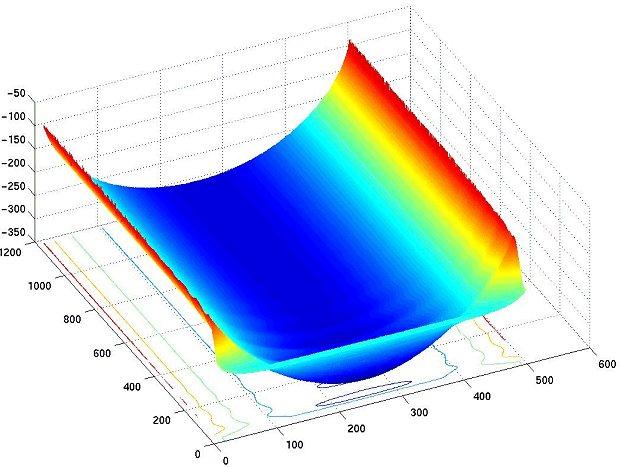
The following figures (Fig. 3 and Fig. 5) show experiment pictures for the total view on the left hand side and for the detail view on the right hand side. In this experiment a fluid is used, which has almost the same refractive index than the cuvette material to minimize disturbances due to refraction. The diameter of the cuvette is D = 30 mm and the coordinate systems are supplementary drawn in the pictures. Below these pictures two figures (Fig.4 and Fig.6) with different surface contour plots, determined with the edge detection routines, are shown. The time difference between two successive contour plots is 0.008 seconds. Fig.7 shows a surface plot of the meniscus contour in pixel coordinates over time, where 1183 pictures are considered for the plot (here the time difference between two pictures is 0.004 seconds). In this plot it can be seen, that at the beginning of the experiment, when the bond number is high (Bo >> 1), the free surface is characterized by a flat shape except for the region near the contact point. When the step reduction in gravity is established (Bo << 1), the reorientation of the free surface with a characteristic oscillation occurs.